Hands-on 01: SAS Studio
- Connect to your working environment
- Access SAS Studio and create a program
- Turn a SAS Studio program into a Flow
Connect to your working environment
Follow the instructions given by your instructor to access your working environment.
Once connected, you should see this:
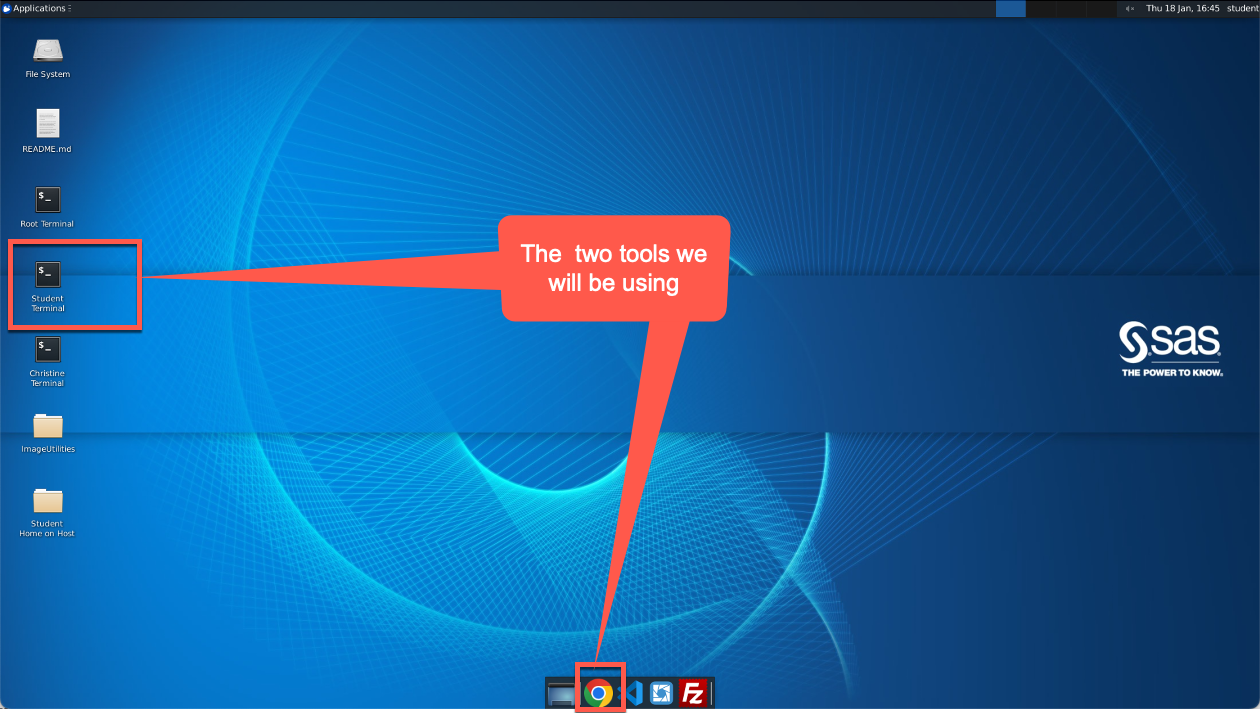
In the exercises of this Hands-on Workshop, you will be using Google Chrome and Student Terminal.
Access SAS Studio and create a program
-
Open the Google Chrome browser (on the toolbar in the bottom middle of the desktop).

Note: if Chrome is already opened, click the
 button to open a new tab
 -
Click SAS Studio in the Google Chrome bookmarks tool bar.

-
Click Sign in to sign in as “student” (password is Metadata0).

-
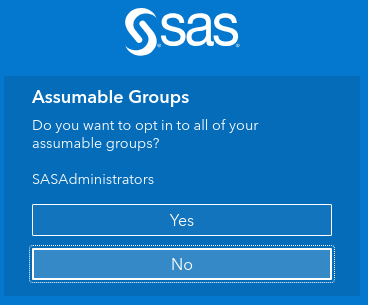
Click Yes when asked to “opt in to all of your assumable groups”.
-
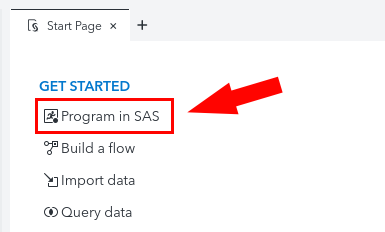
Click Program in SAS to create a blank program.
-
Copy the following sample program, and paste it into the code box (use CTRL + V):
/*************************************************/
/* Top N report for data across categories       */
/* Use macro variables to customize the data     */
/* source.                                       */
/* DATA - SAS library.member for input data      */
/* REPORT - column to report on                  */
/* MEASURE - column to measure for the report    */
/* MEASUREFORMAT - specify to preserve measure   */
/*  format in the report (currency, for example) */
/* STAT - SUM or MEAN                            */
/* N - The "N" in Top N - how many to show       */
/* CATEGORY - across which category?             */
/*************************************************/
%let data=SASHELP.CARS;
%let report=Model;
%let measure=MPG_City;
%let measureformat=%str(format=BEST6.);
%let stat=MEAN;
%let n=10;
%let category=Origin;
title "Top Models by MPG_City for each region of Origin";
footnote;

/* summarize the data across a category and store */
/* the output in an output data set */
proc means data=&data &stat noprint;
	var &measure;
	class &category &report;
	output out=summary &stat=&measure &category /levels;
run;

/* store the value of the measure for ALL rows and
/* the row count into a macro variable for use  */
/* later in the report */
proc sql noprint;
select &measure,_FREQ_ into :overall,:numobs
from summary where _TYPE_=0;
select count(distinct &category) into :categorycount from summary;
quit;

/* sort the results so that we get the TOP values */
/* rising to the top of the data set */
proc sort data=work.summary out=work.topn;
  where _type_>2;
  by &category descending &measure;
run;

/* Pass through the data and output the first N */
/* values for each category */
data topn;
  length rank 8;
  label rank="Rank";
  set topn;
  by &category descending &measure;
  if first.&category then rank=0;
  rank+1;
  if rank le &n then output;
run;

/* Create a report listing for the top values in each category */
footnote2 "&stat of &measure for ALL values of &report: &overall (&numobs total rows)";
proc report data=topn;
	column &category rank &report &measure;
	define &category /group;
	define rank /display;
	define &measure / analysis &measureformat;
run;
quit;


/* Create a simple bar graph for the data to show the rankings */
/* and relative values */
/* Calculate size of chart based on number of category values */
goptions ypixels=%eval(250 * &categorycount) xpixels=500;
proc gchart data=topn
;
	hbar &report /
		sumvar=&measure
		group=&category
		descending
		nozero
		clipref
		frame
		discrete
		type=&stat
		patternid=group
;
run;
quit;
-
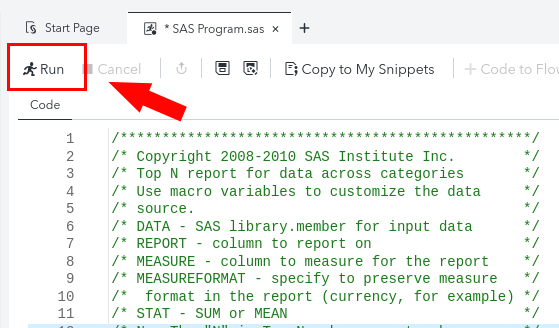
Click Run to run the program and then view the output and logs.
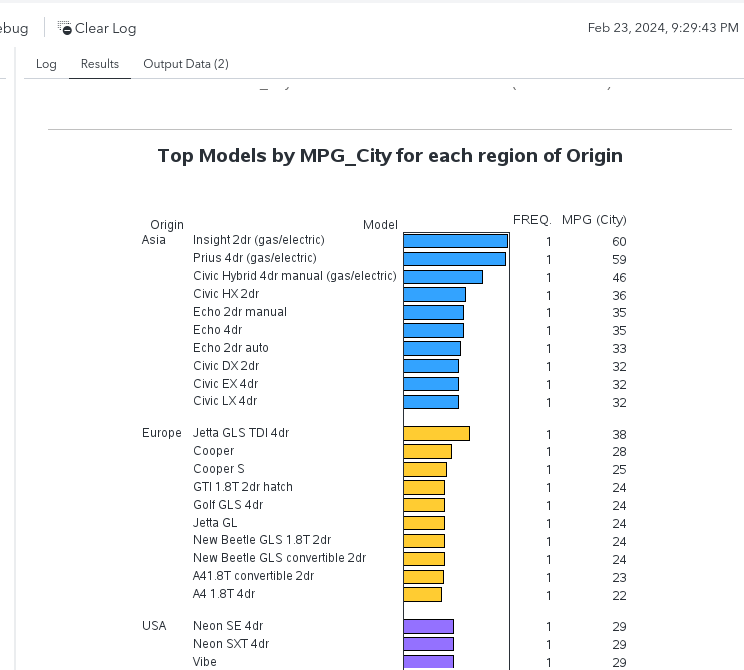
On the Results tab we can see the output of the program: a table and a horizontal bar chart.
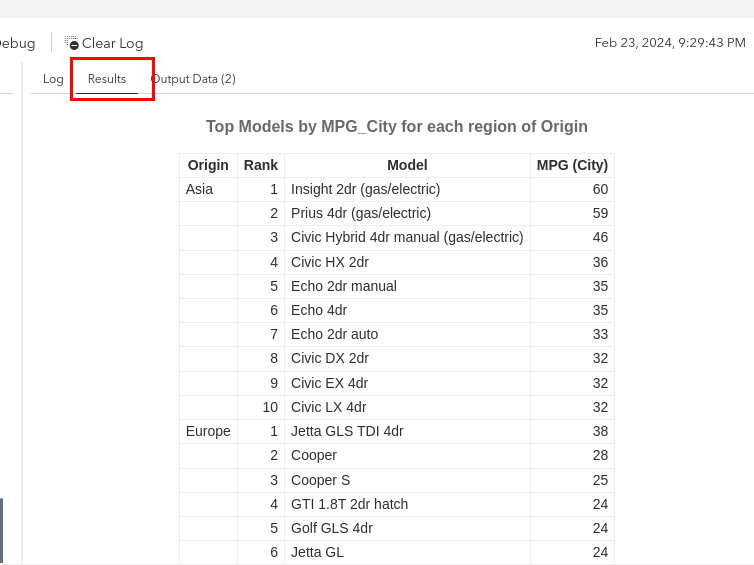
scroll down to see the bar chart
Viewing the log, we see that our program initially read in 428 observations from the SASHELP.CARS data set, and that only 30 observations were read into the final gchart procedure (step to make the bar chart).

scroll through the lower window of the log to see the information for each program step
-
Save the program.
For the next exercise, we’ll need the test program we just created to be saved.
Click the save icon:

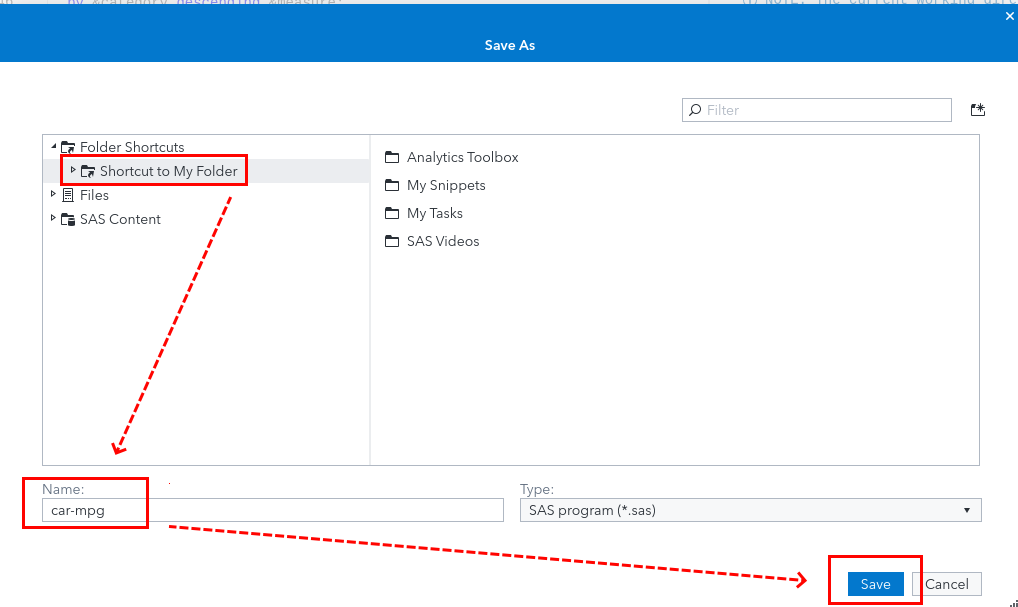
Under “Folder Shortcuts” click Shortcut to My Folder and rename the program to “car-mpg”. Click save to save the program to the personal folder for the student account:
Turn a SAS Studio program into a Flow
-
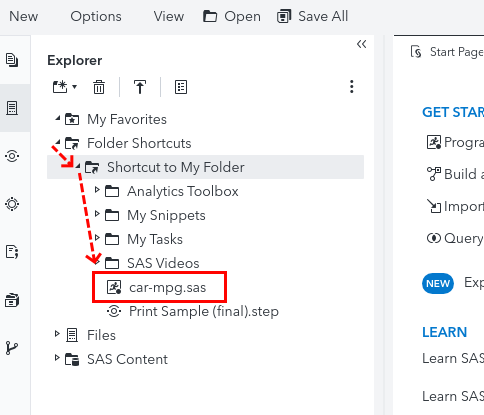
Access the file explore window on the left-hand side of SAS Studio.
Under “Folder Shortcuts” and “Shortcut to My Folder” should be the car-mpg.sas file.
-
Right-click car-mpg.sas and select “Create flow from program”.

-
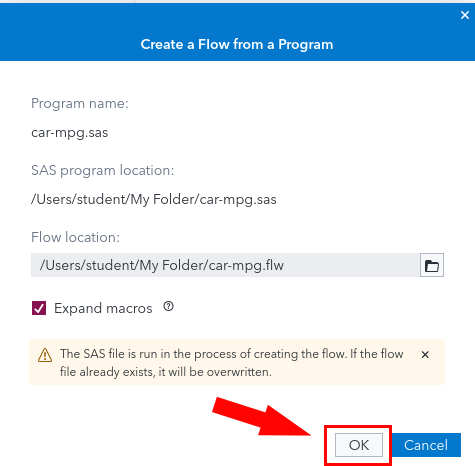
Click Ok to create the flow from our SAS Studio program.
-
View the flow.
A new tab in SAS Studio will be created. Click it to view the flow.

Each step in our original program is given a “node” in the flow.
-
Run the newly created flow.
Select the Run button and view the output in the “Results” tab.
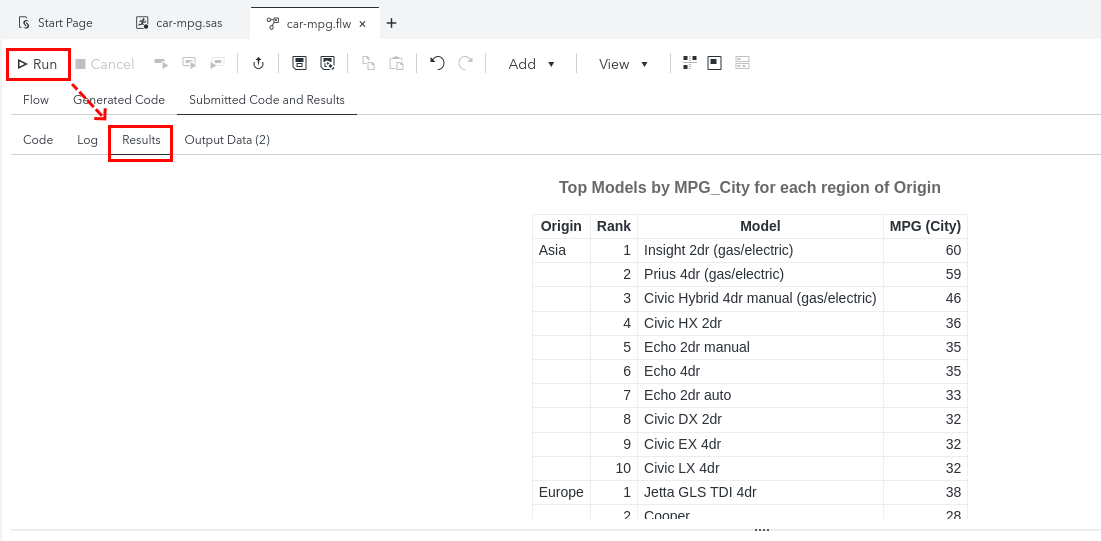
the output should be identical to the output from the car-mpg.sas program
-
Click a given node to view the associated code.

-
View the details for a given node by navigating to the node tab.

Here you can view the input variables, output variables, name, and description of the node. It’s also possible to replace the contents of the node with a different file, or download the code associated with the node. Clicking “Save as a file” on the SQL node will prompt you to save a “.sas” file containing only the SQL procedure.